
By Tom Adams · Tom Adams Research
The U.S. legal cannabis market looks anemic, with the 22 BDSA-tracked markets rising just 2.6% in the first nine months of 2026 (BDSA’s panel was 87.7% of the national market in 2025). That doesn’t even match the country’s stubborn consumer inflation rate of 3.7%.
National growth rates are hobbled by older markets out west that all declined in 2025 and are mostly down again this year. But business is booming along the banks of, and east of, the Mississippi, where longtime consumers are enjoying the novelty of legal access, and former abstainers are dipping their toes into finally legal cannabinoid markets.
The current generation of growth drivers in the U.S. are Minnesota (the river runs through it), Connecticut, Delaware, Ohio, New York, Maryland, New Jersey, and Missouri (where the Big Muddy joins the “Father of Waters”). Retail revenue in those eight states grew 12.9% through September, adding $681 million to national totals that grew only $524 million over the same nine months, held back by declines in more mature markets.
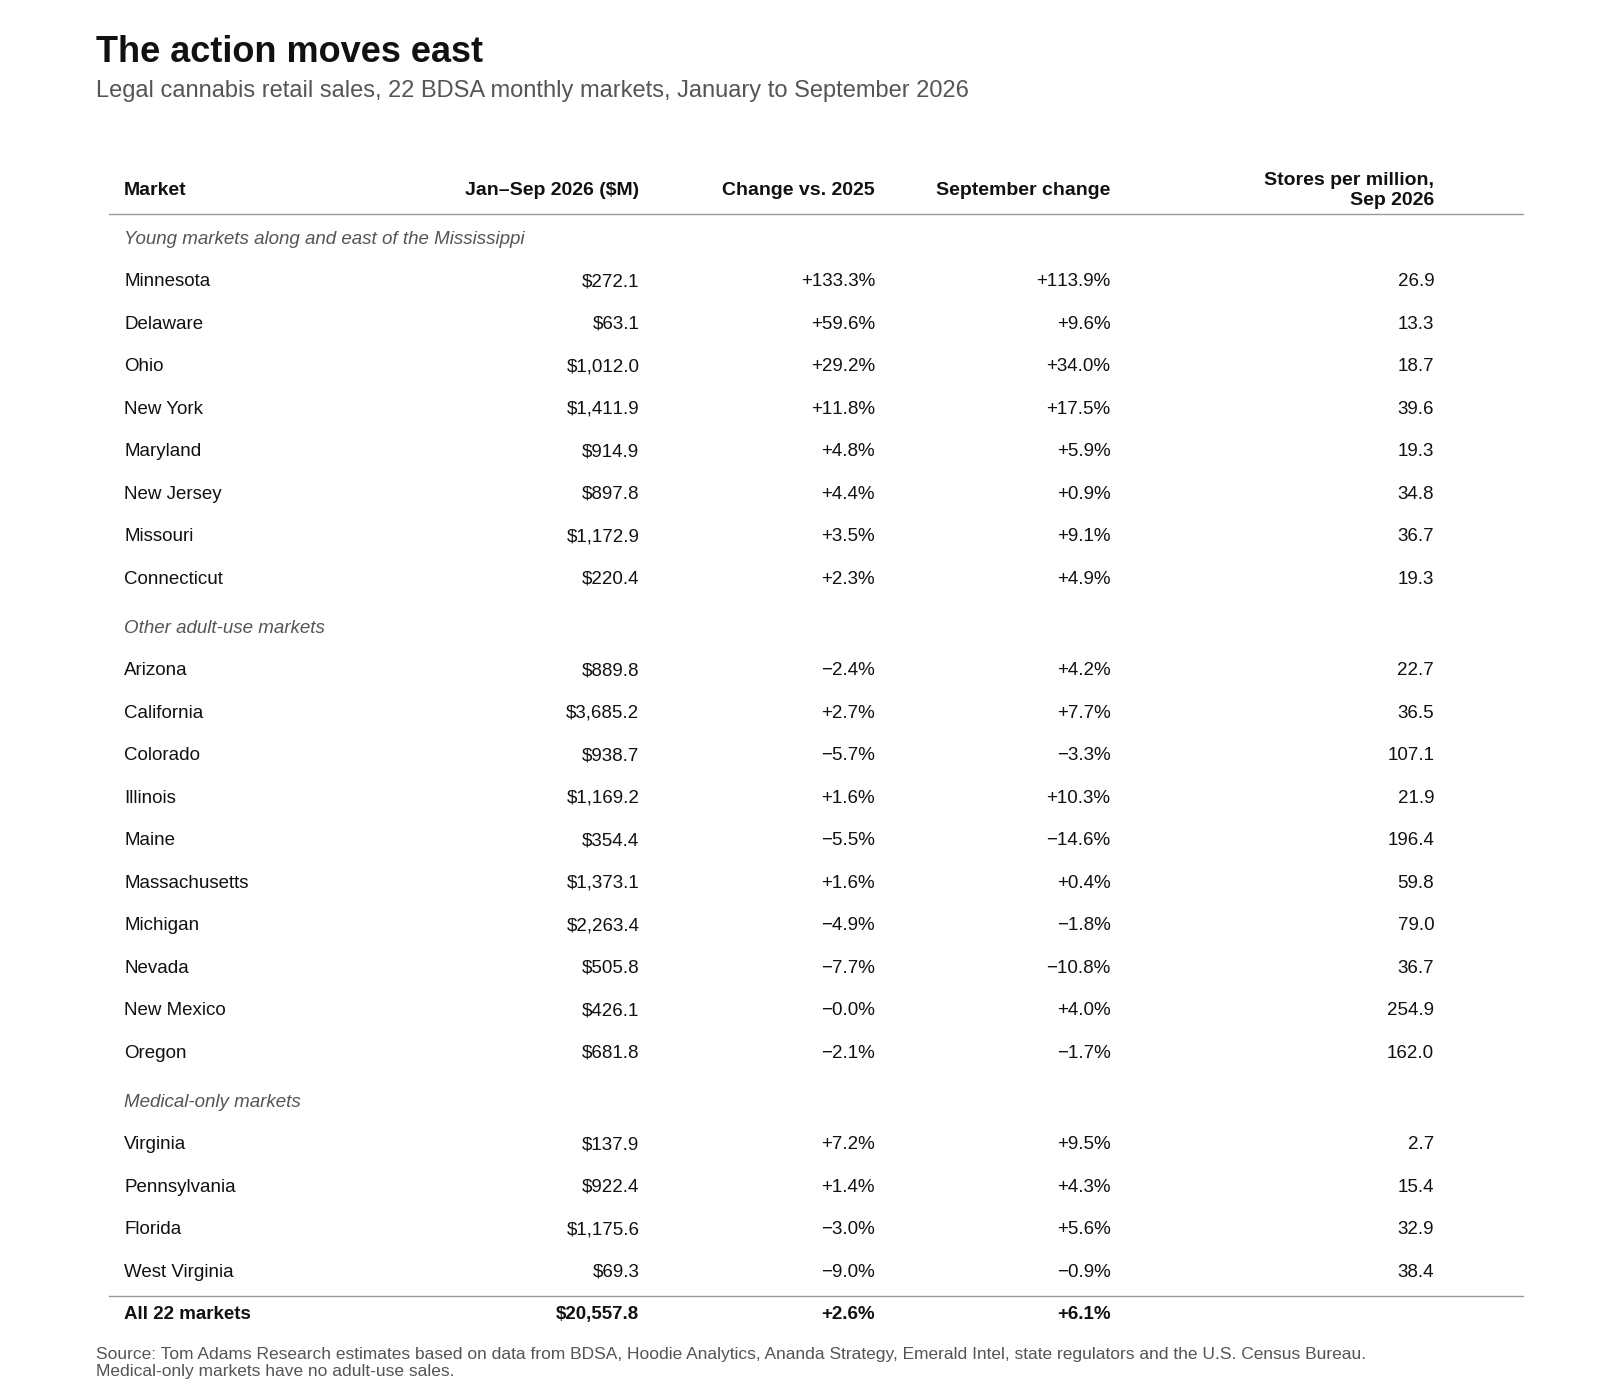
Ohio, Minnesota and New York have added the most dollars year-to-date through September: $229 million, $155 million and $149 million, respectively. BDSA projects that those three young adult-use markets, plus about-to-legalize Virginia, will supply about half of U.S. growth through 2030.
But market growth is only half the recipe for success of individual stores in those states. The other half is the market share they can capture and keep, and across the 18 adult-use markets BDSA tracks, stores in states that cap licenses averaged nearly twice the revenue over the past 12 months as stores in states that don’t. So, can new adult-use states see both market growth and healthy per-store revenue at the same time?
New stores pay off, until they don’t
Ohio’s answer so far is yes, because it is just getting started opening AU stores. An average of 197 stores were open over the 12 months to September, which works out to 17 per million residents, less than a third of Massachusetts’ store density and a quarter of Michigan’s. Because access is still spotty, Ohioans spent just $90 each on legal cannabis in 2025, less than a third of the $313 in per-capita spending in Michigan. Those 197 Ohio stores took in $6.6 million each, against $4.3 million in Massachusetts and $3.9 million in Michigan. So far every new Ohio door has added more to the state’s total revenue than it has taken from the doors already open, so per-store revenue is still on the rise.
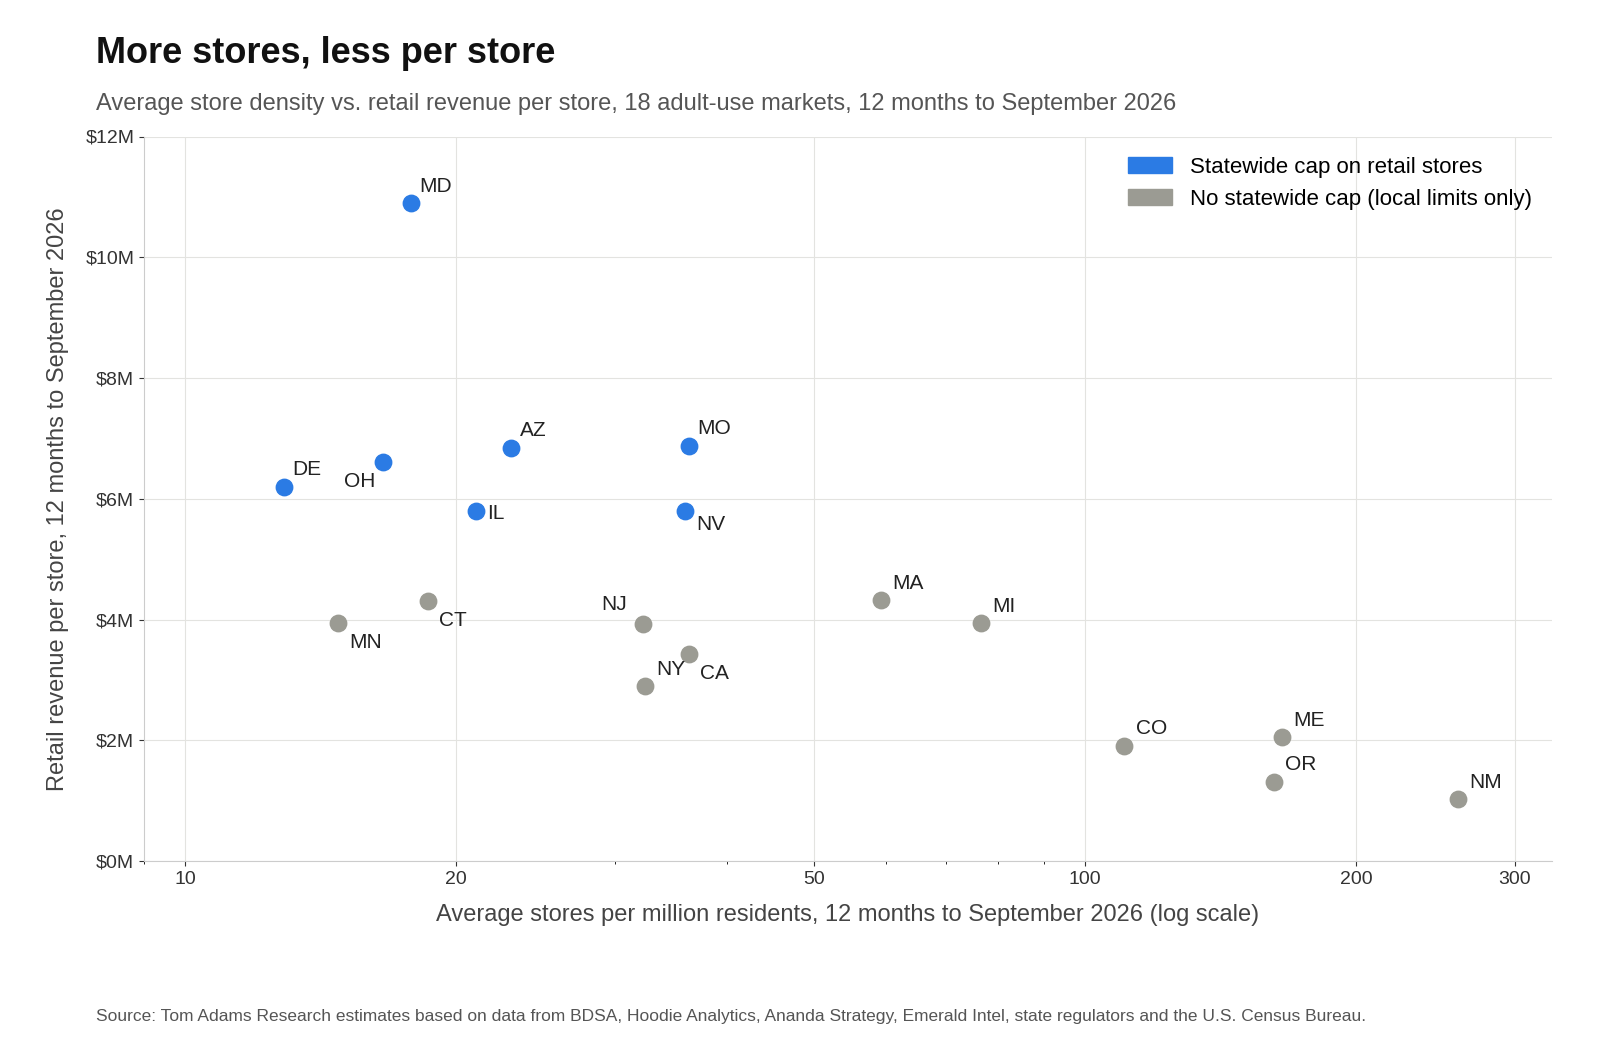
That makes Ohio unique across the 18 adult-use markets BDSA tracks. Typically, states with more stores per resident see more revenue per resident, but their retailers take in less per store (see graph). What determines both those ratios is competition: the number of stores sharing each million residents. Statewide caps on store licenses keep that number low, even before the limit is reached, because licenses are issued, and stores open, in successive rounds.
Hence, the median capped state averaged 21 stores per million residents over the past 12 months and its stores averaged $6.6 million in revenue; the median uncapped state averaged 59 stores per million and $3.4 million a store. Store revenue in every capped state is higher than in every uncapped state. At the extremes, Maryland’s 112 stores averaged $10.9 million at 18 stores per million residents; New Mexico’s 553 stores averaged $1.0 million at 260 stores per million.
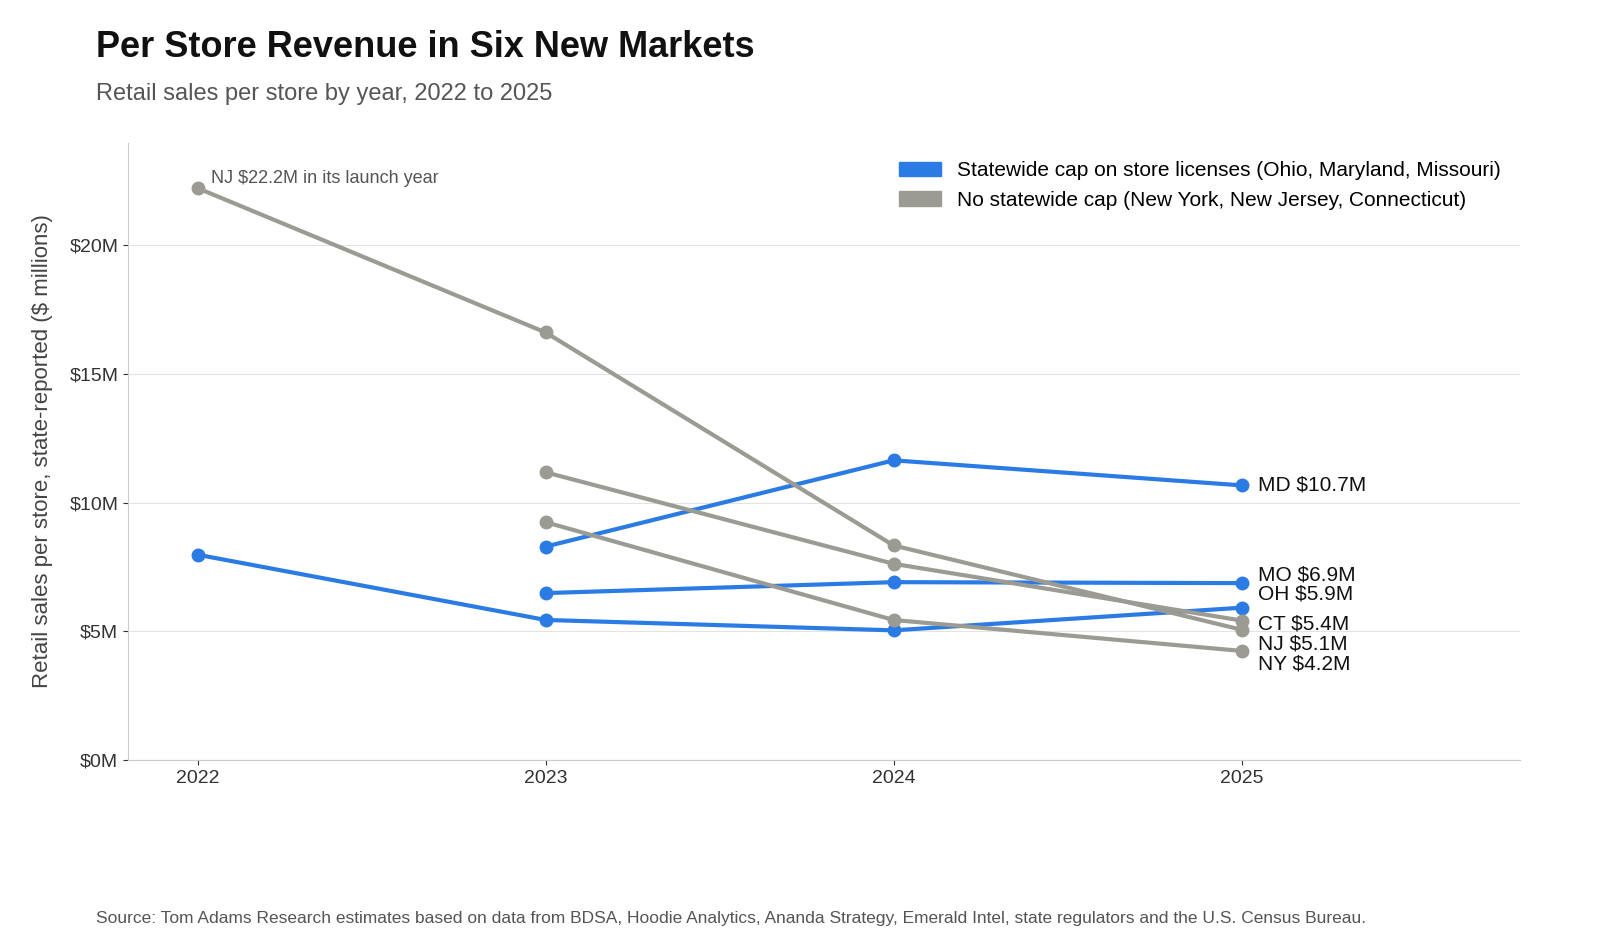
Within the eight young markets, revenue per store has held or risen after the launch year only where store-counts are capped: Ohio’s per-store average rose 17% in 2025 despite the opening of 34% more stores, Missouri’s has stayed near $6.9 million for three years, and Maryland’s held above $10 million in 2025, due to minimal store-count growth below a state maximum.
But without a cap revenue-per-store falls as fast as the doors open: New York from $9.2 million a store in 2023 to $4.2 million in 2025, New Jersey from $22 million in its launch year to $5.1 million, Connecticut from $11.2 million to $5.4 million (see graph). Massachusetts, Michigan, Maine, Vermont, California and Colorado all showed similar slides in per-store revenue during their retail roll-outs.
Where the stores are, in detail
These are all statewide averages though. Where the stores are located in a state matters as much to retail success as how many there are in total. For example, Massachusetts has no statewide cap, but 118 of its 351 cities and towns ban retail, and 31% of residents live in them. Thus, its 427 stores serve the other 69% of the population, at 87 outlets per million. That is Michigan-like density, and it comes with Michigan-like prices: flower is down 31% since 2023 and an eighth sells for $5 a gram.
California shows the same kind of regional variations in store density, and hence per-store revenue. Statewide it has 37 stores per million, New York’s level. But 45% of Californians live where storefronts are banned, so where they are allowed the density is 67 per million. The range of results is enormous: San Diego has 24 stores per million and its stores average $7.6 million a year. Los Angeles has 74 and the average is just $2.5 million. At the extreme, West Hollywood has 12 stores for 34,000 people, and they are averaging just $2.0 million; stores in overcrowded Palm Springs do $1.3 million and in Cathedral City the average is a mere $670,000 annually.
Prices hold where doors are few
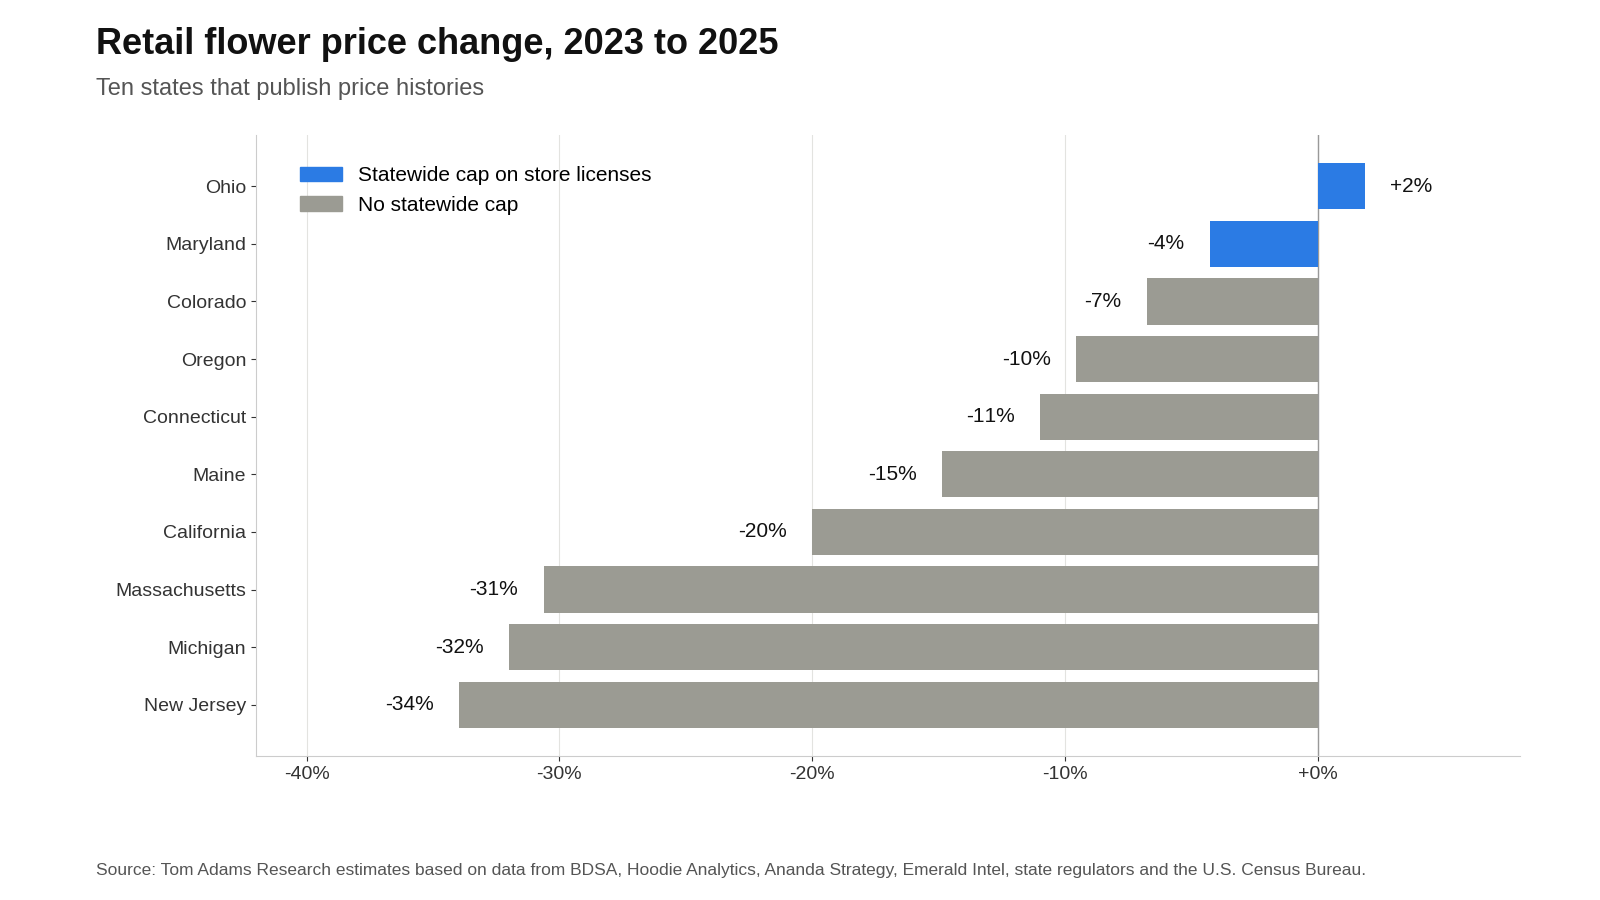
Beyond the sharing of consumer demand, price competition is the key factor keeping per-store revenue down in the most competitive states. Retail flower average prices actually rose 2% in license-capped Ohio and only fell 4% in Maryland from 2023 to 2025, while they fell 32% in wide-open Michigan, 31% in Massachusetts and 34% in New Jersey (see graph). Headset puts an eighth at about $8 a gram in Ohio and Maryland this September, double the $4 in Michigan and Colorado.
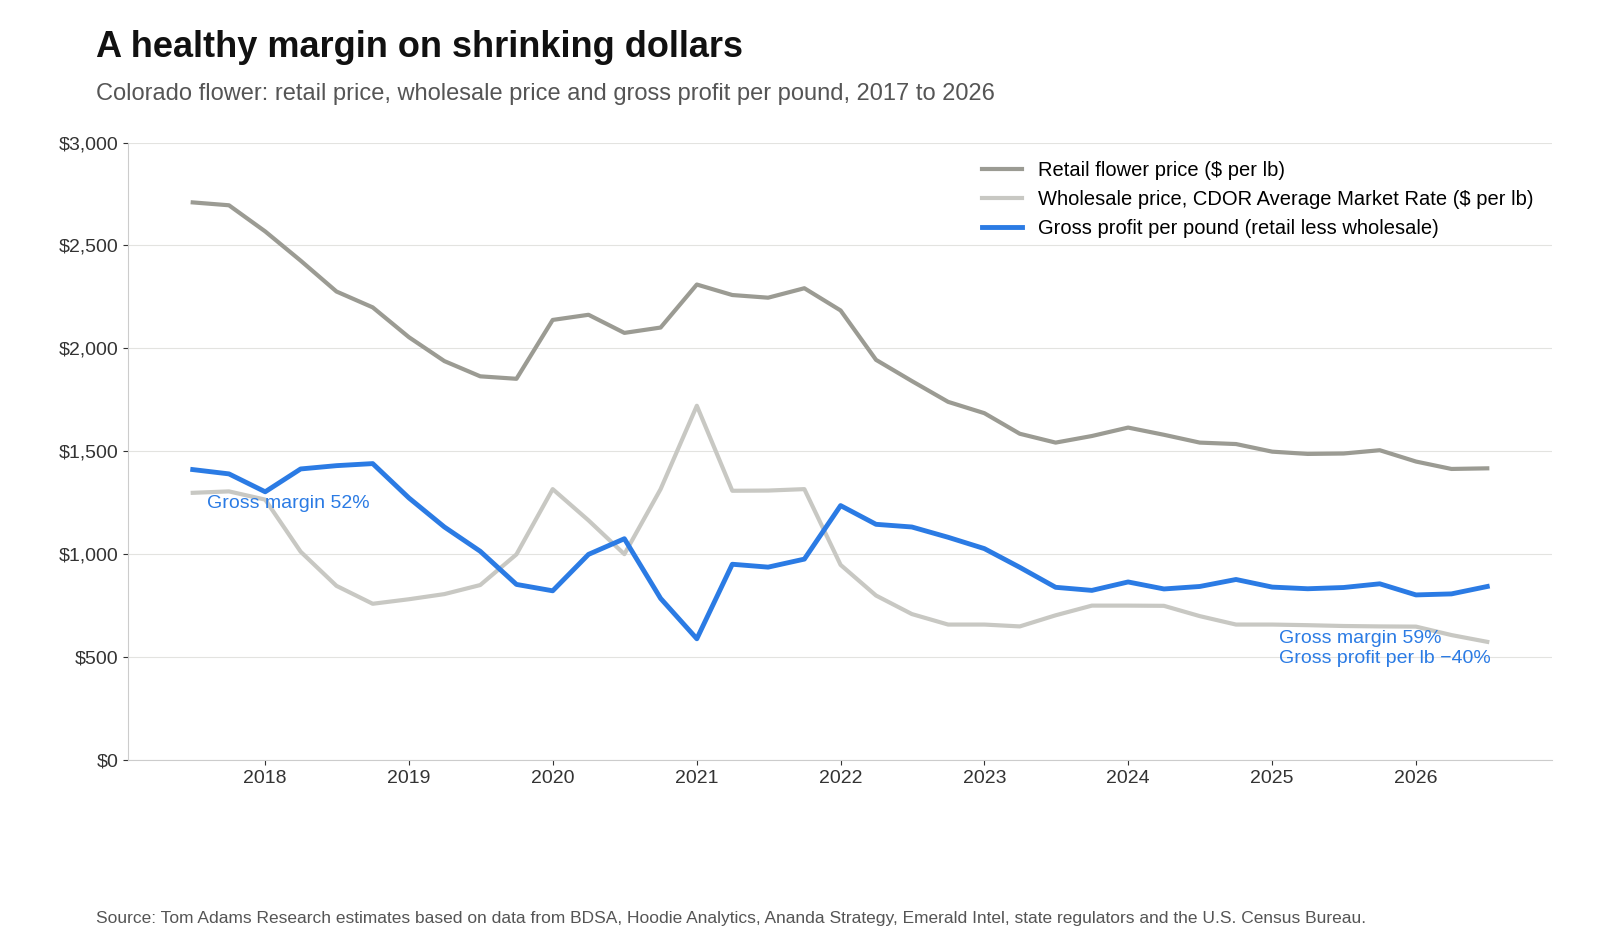
Holding price is not the same as holding margin, and the one state that publishes wholesale prices shows why revenue per store is a useful measure of retail health, but not a perfect proxy for profitability and ROI. Colorado’s wholesale flower price has fallen 56% since 2017 and its retail price 48%, so the retailer’s gross margin on flower widened from about half the shelf price to nearly 60%. But gross profit dollars per pound fell 40% (see graph). A healthy margin percentage on shrinking dollars per door is how retailers go broke slowly, which is why Colorado’s store count is declining.
How limited-license roll-outs shape the market
Two kinds of license caps are at work around the country. Where the store quota was set near the existing medical base, as in Arizona, Missouri and Nevada, it filled at launch by conversion and froze density there. Where a cap leaves headroom, the new licenses typically go to applicants in rounds that slow the roll-out of new doors.
Beyond the regulatory mechanics, limited licensing is slow by nature: a scored application or even a lottery invites lawsuits from the losers, and the winners then need capital, a lease and a willing town. Illinois has filled a little over half of its 500 in six years, after its 2021 lottery results sat in court for a year; the first winners opened in 2023. Maryland has filled about 40% of its 310 cap over three years, with its first social-equity round, awarded in January 2024, still opening. Ohio has filled just over half of its 400 in two years, with the first additional licenses having gone to the operators already there.
Even at its 400-store cap, Ohio would have 34 stores per million, little more than half of Massachusetts. That’s why seven of the ten largest companies in our Global Cannabis 50 have stores in Ohio. All told, a dozen public companies own or brand about 30% of Ohio’s open dispensaries.
A store-cap buys time, but not immunity, from the legal market’s inexorable price declines. Maryland’s flower price is down 10% so far this year and Ohio’s 3%, and neither state’s store count is yet at its statutory ceiling. Retailers should brace for further declines, even if regulators leave the caps in place. If they lift the caps, look out below. How long each young market keeps licenses scarce is the question that matters most to anyone who owns one.
The window for profitable investment in cannabis retail is wherever and whenever the legal doors are still few: Ohio, Maryland and Missouri under their caps, Virginia when its first 350 licenses are issued next year, and in the local opt-out states, the towns that said yes located next to the ones that said no. But you’ve got to get it while you can: a store-cap is just a line in a statute, and every regulator that wrote one into its cannabis regime can rewrite it.
TOM ADAMS is President and Principal Analyst at Tom Adams Research, and has covered cannabis markets since 2016. He was previously Managing Director of BDSA’s Industry Intelligence group and Editor-in-Chief of Arcview Market Research. Tom Adams Research advises operators, investors and regulators on where cannabis markets are going and which regulatory regimes produce healthy ones. adamsresearch.net